Visualising the Biographical Register of the University of St Andrews (1747-1897) Part I: Where Did St Andrews Alumni Come From?
Tomas Vancisin shares his recent work creating a visual representation of the Biographical Register of the University of St Andrews, 1747 – 1897 in a two part blog.
One of my favourite books is called Embracing the Wide Sky by Daniel Tammet, a synesthete with savant syndrome for whom numbers and words have unique shapes and colours (see Fig. 1). Tammet’s mind-bending perception of the world fascinates me and fuels my interest in the field of data visualisation where human perception plays a central role.

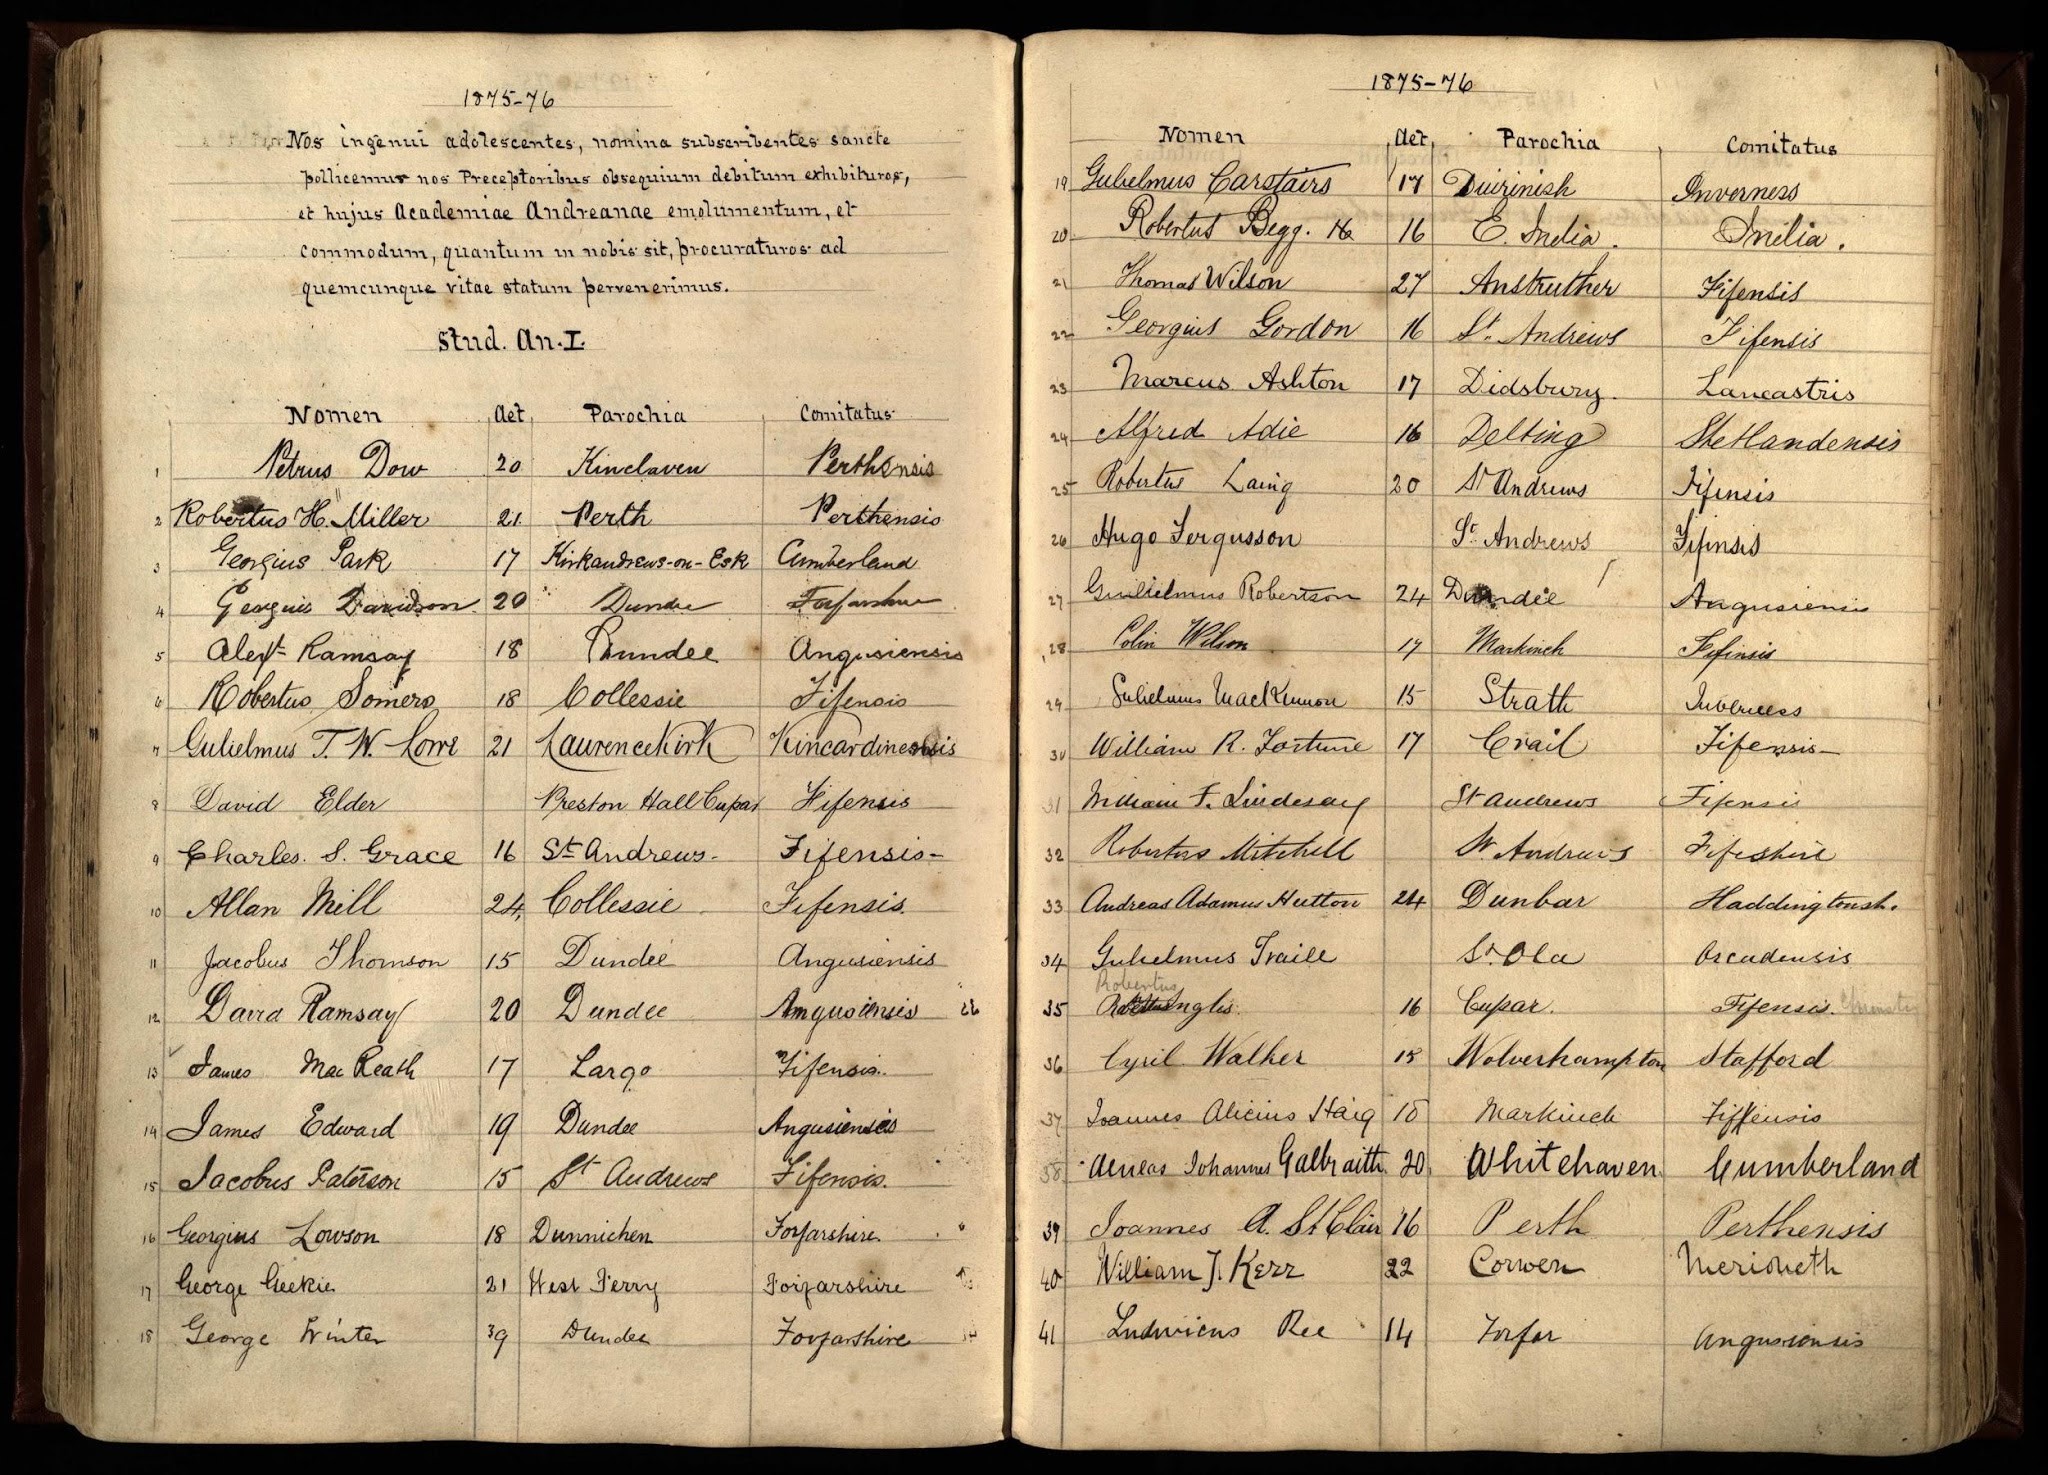
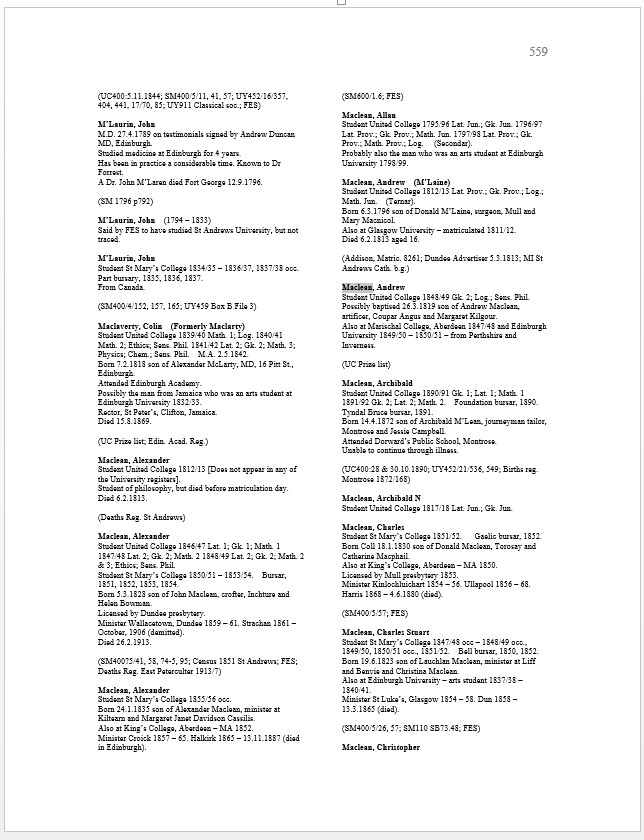
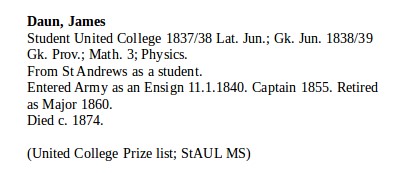
In the light of Tammet’s π, one of the aims in my MSc thesis, supervised by Dr Uta Hinrichs (School of Computer Science) and Prof Mary Orr (School of Modern Languages), was to give ‘shape and colour’ to the Biographical Register of the University of St Andrews, 1747 – 1897 (BRUSA). This unique work was compiled over the course of 40 years by Dr Robert N Smart, Keeper of Manuscripts and Muniments in the University, using a wide range of sources, primarily the University’s own archives (Fig. 2), supplemented by printed sources and his own wide-ranging research. It contains biographical sketches of nearly 12,000 university alumni and staff. 9 years after its publication (2004), the printed version (see Figures 3 and 4) underwent a digitisation process led by Dr Alice Crawford. This resulted in a web-based platform which enables a quick search of BRUSA. Even though limited to close reading techniques, the project vastly expanded the possibilities for future research and provided the ‘backbone’ for my thesis.
Prior to giving BRUSA a visual representation using the visualisation tool Tableau, we developed software which transformed the data from Crawford’s project into a database. Having the information in a structured form subsequently enabled conducting complex queries and provided the basis for graphical overviews consisting of four visualisations, each representing a different insight into the register.
Alumni/Staff Overview & Geographic Distribution
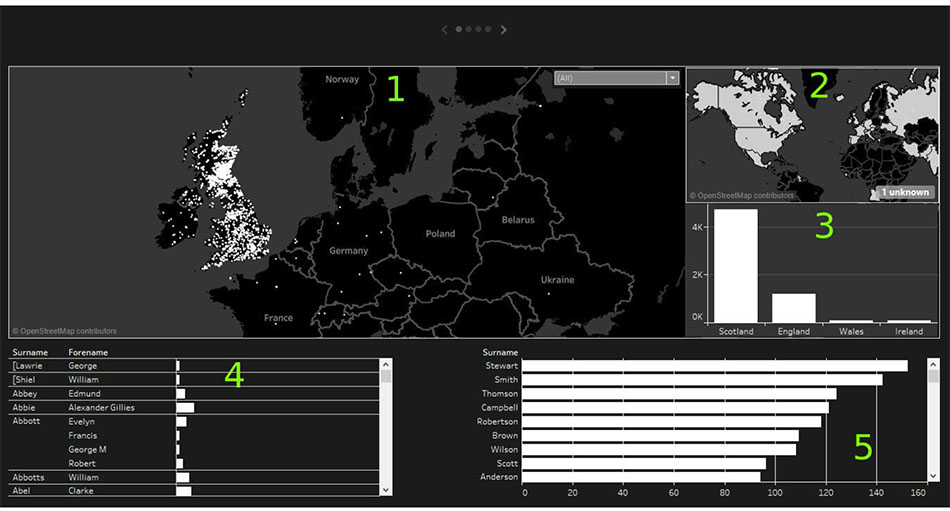
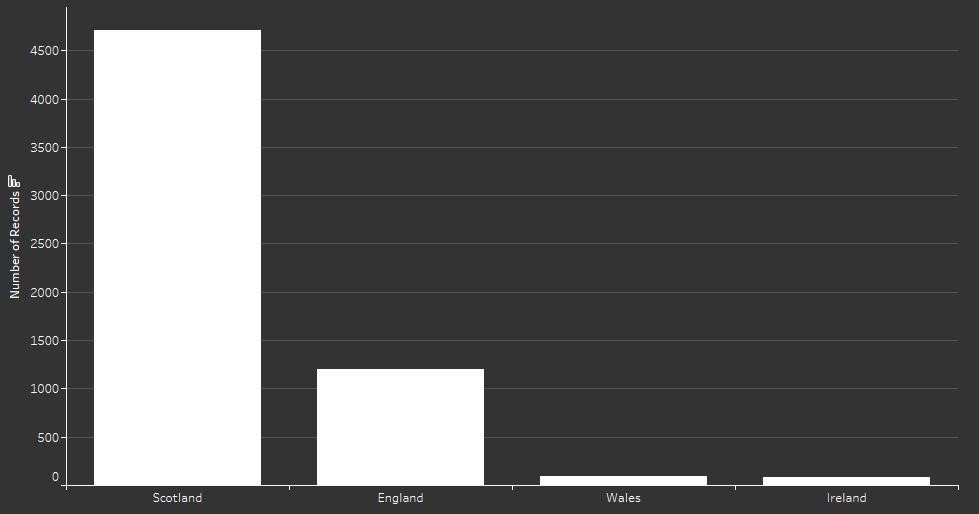
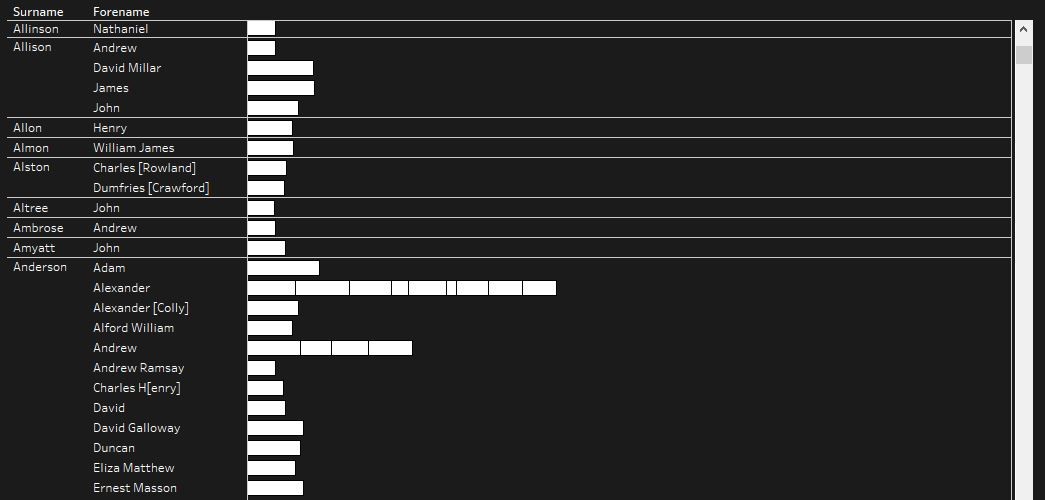
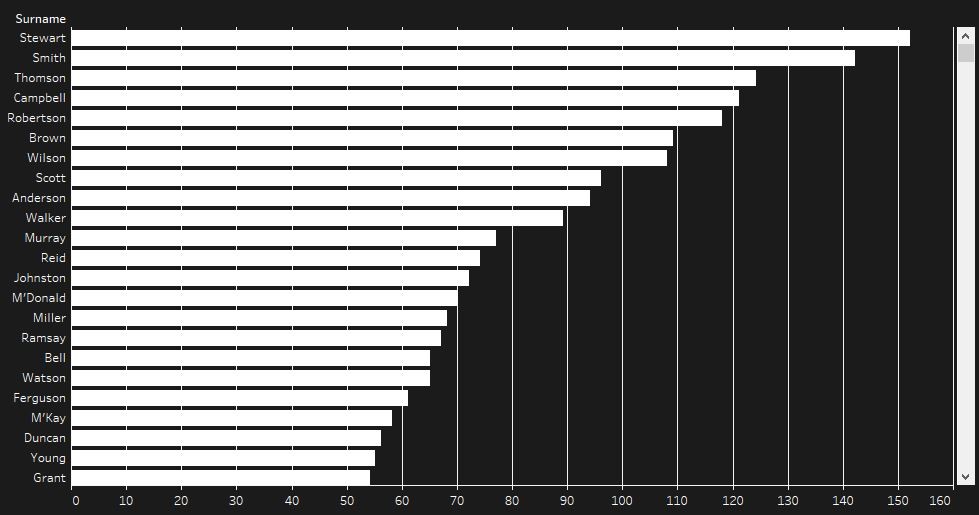
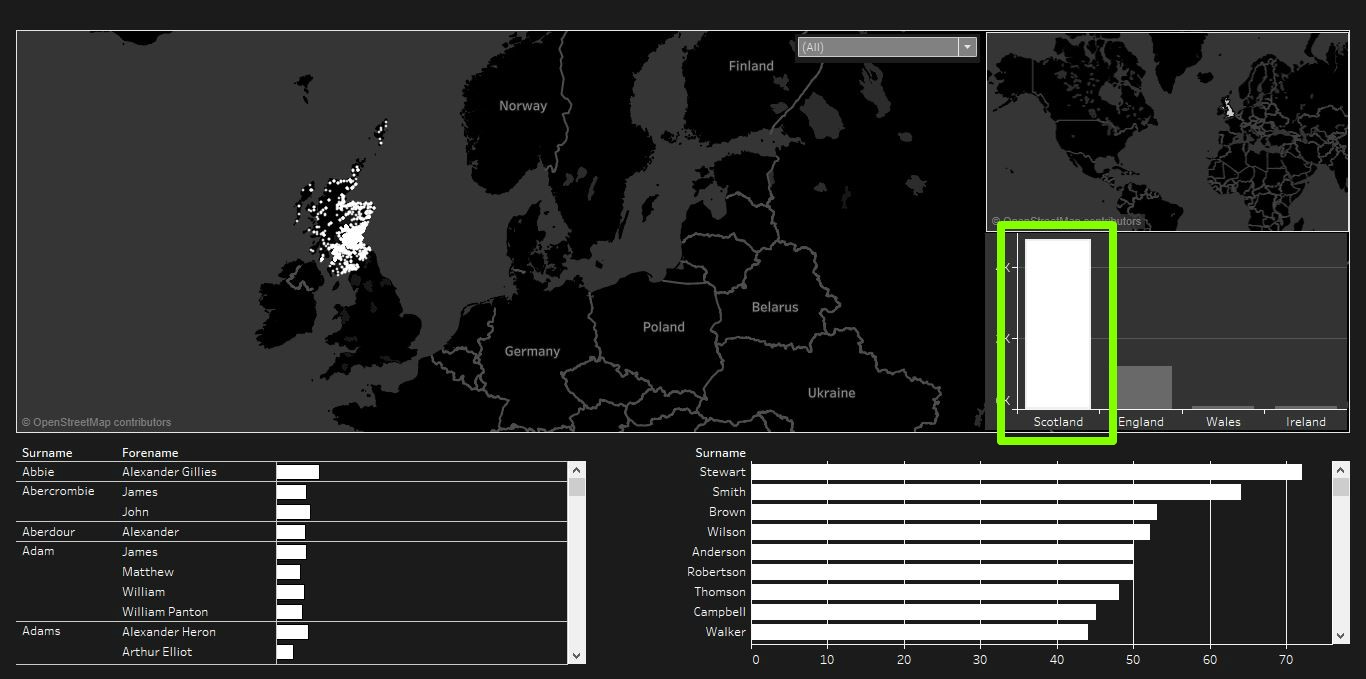
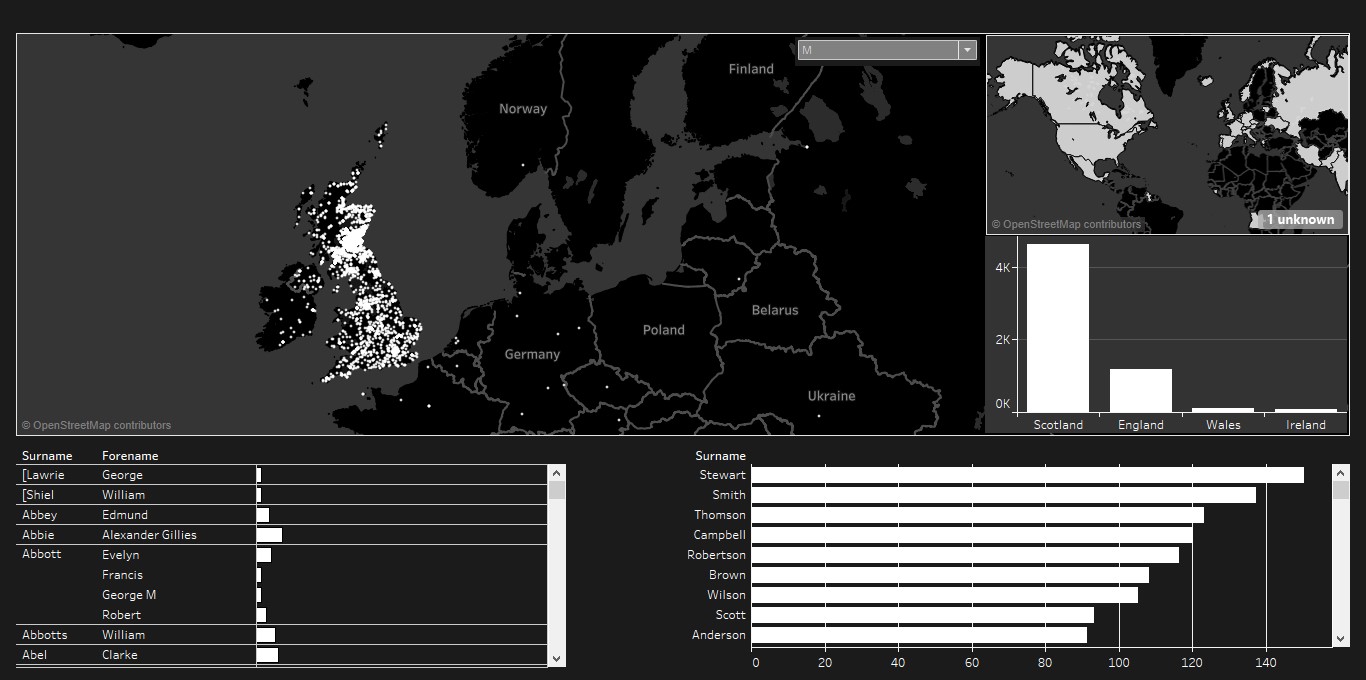
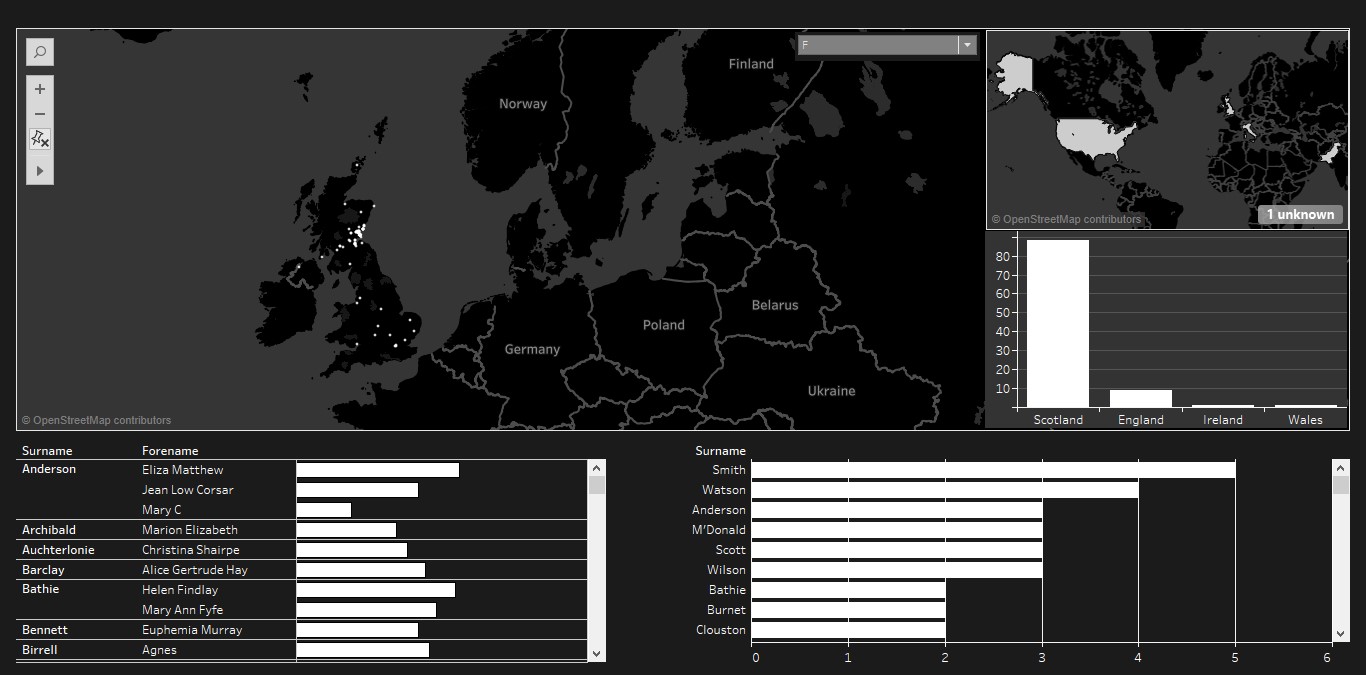
The first visualisation (see Fig. 5) provides an overview of all the names in BRUSA and shows all alumni/staff birth locations that it was possible to extract from the register. It contains five different views: View 1 shows birth locations and enables the user to ‘dig down’ and focus on a particular area (see Fig. 6) or zoom out and explore the distribution of birth coordinates on a larger scale (see Fig. 7). View 2 presents a filled-map overview of the alumni/staff birth countries (see Fig. 8). The third view displays the distribution of alumni/staff from England, Ireland, Scotland and Wales using a bar chart (see Fig. 9). View 4 lists all alumni/staff family names with horizontal bars indicating the amount of information available for the given person (see Fig. 10) and the last view shows a bar chart that features the most common surnames (see Fig. 11). All the elements (locations, countries, names, bars, graphs etc.) in these four visualisations are interactive and act as filters for the entire interface. For example, clicking on one of the bars in View 3 will change the entire visualisation accordingly (see Fig. 12). In addition, the gender filter (see Fig. 13) allows the user to see differences between male and female alumni/staff (see Figures 14 and 15).

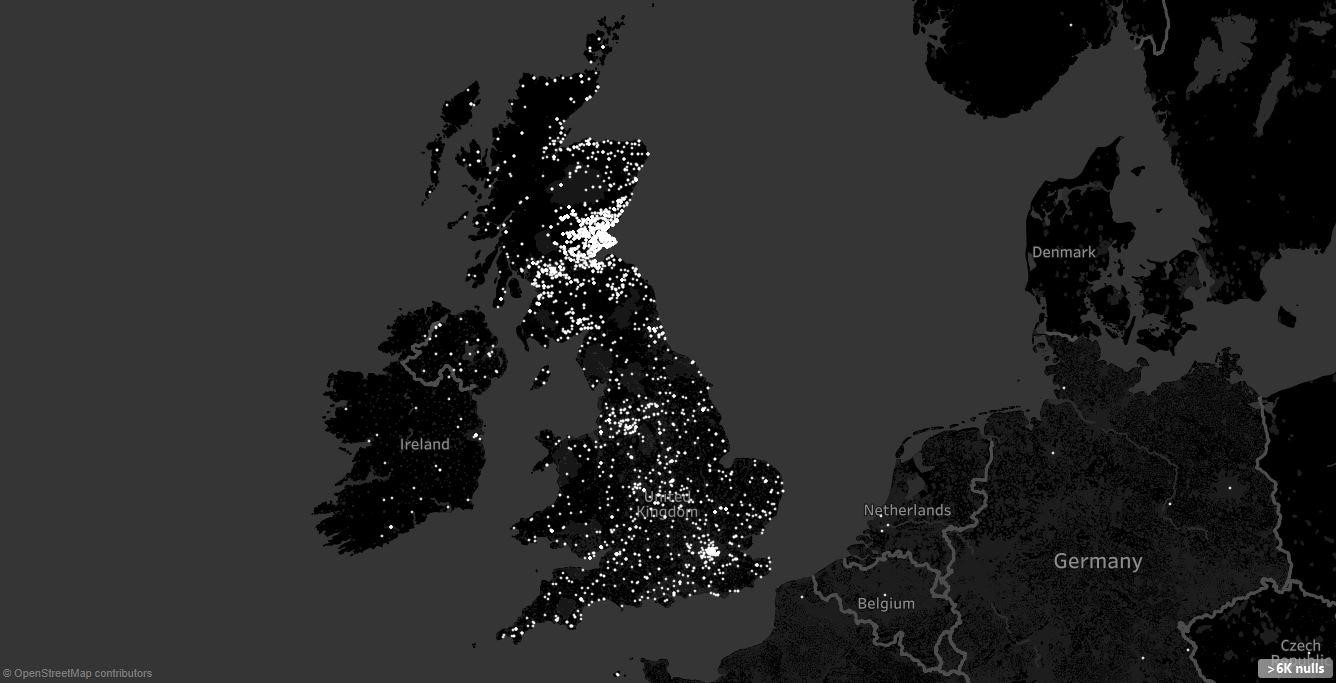


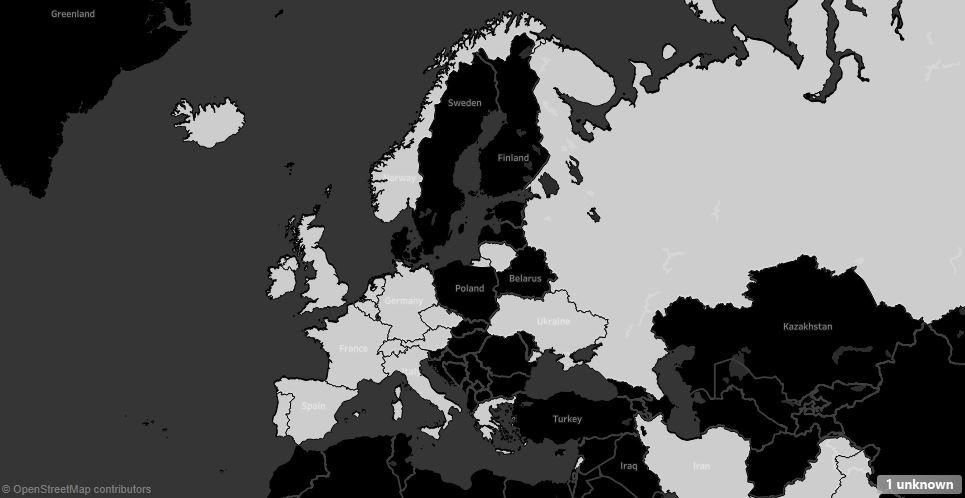
When it comes to interesting aspects revealed by this visualisation, the distribution of non-UK birth countries is certainly one of them. It could be argued that the majority of these countries belonged to the British Empire of the time. However, the University’s far-reaching reputation is emphasised by the distribution of birth locations in Europe (see Fig. 16) as well as the caveat that half of the records in BRUSA did not include this information. It was clearly not possible for Smart to provide 100% of data for all individuals. Working with an incomplete register emphasises that visualisations can be only as good as the original data and it is absolutely crucial to bear in mind that information visualisation has its limits. Nevertheless, this does not mean that graphical representation of BRUSA should be overlooked as it provides new scholarly insights unobtainable through close reading.
Tomas Vancisin
In Part II, Thomas will discuss the visualisations of BRUSA which focus on the students, degrees and LLA subsets of the data.